Scroll down for more
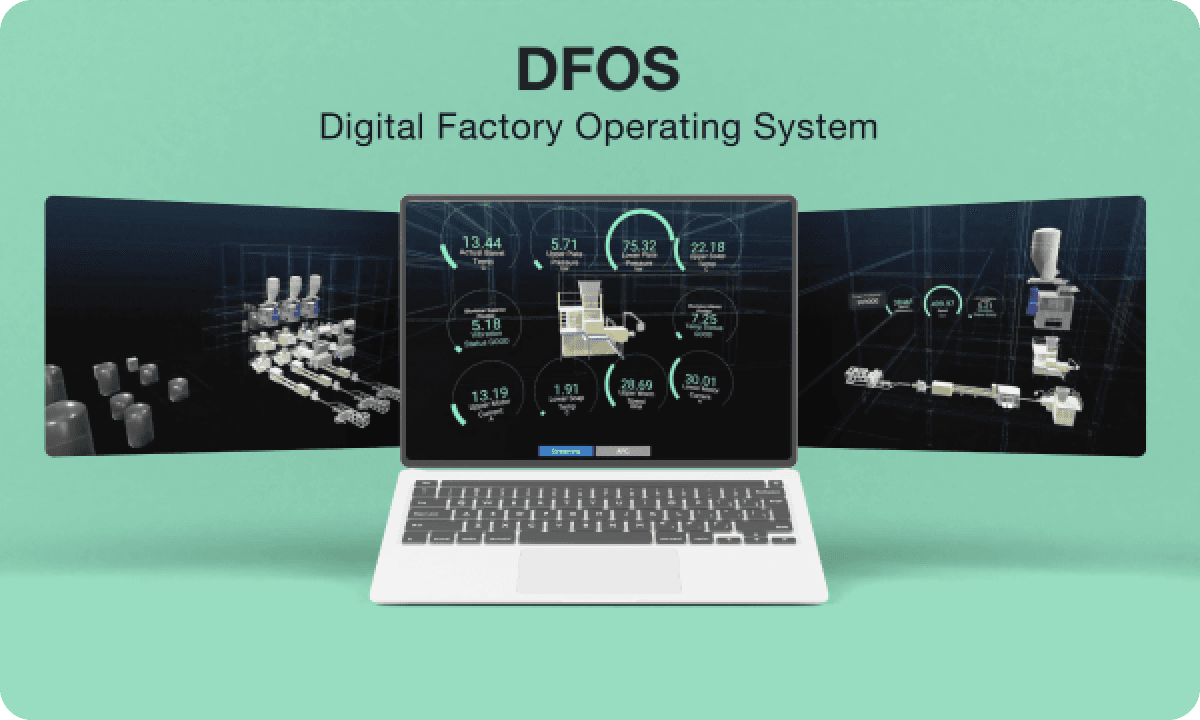
 Digitizing your factory operations in the 4.0 era
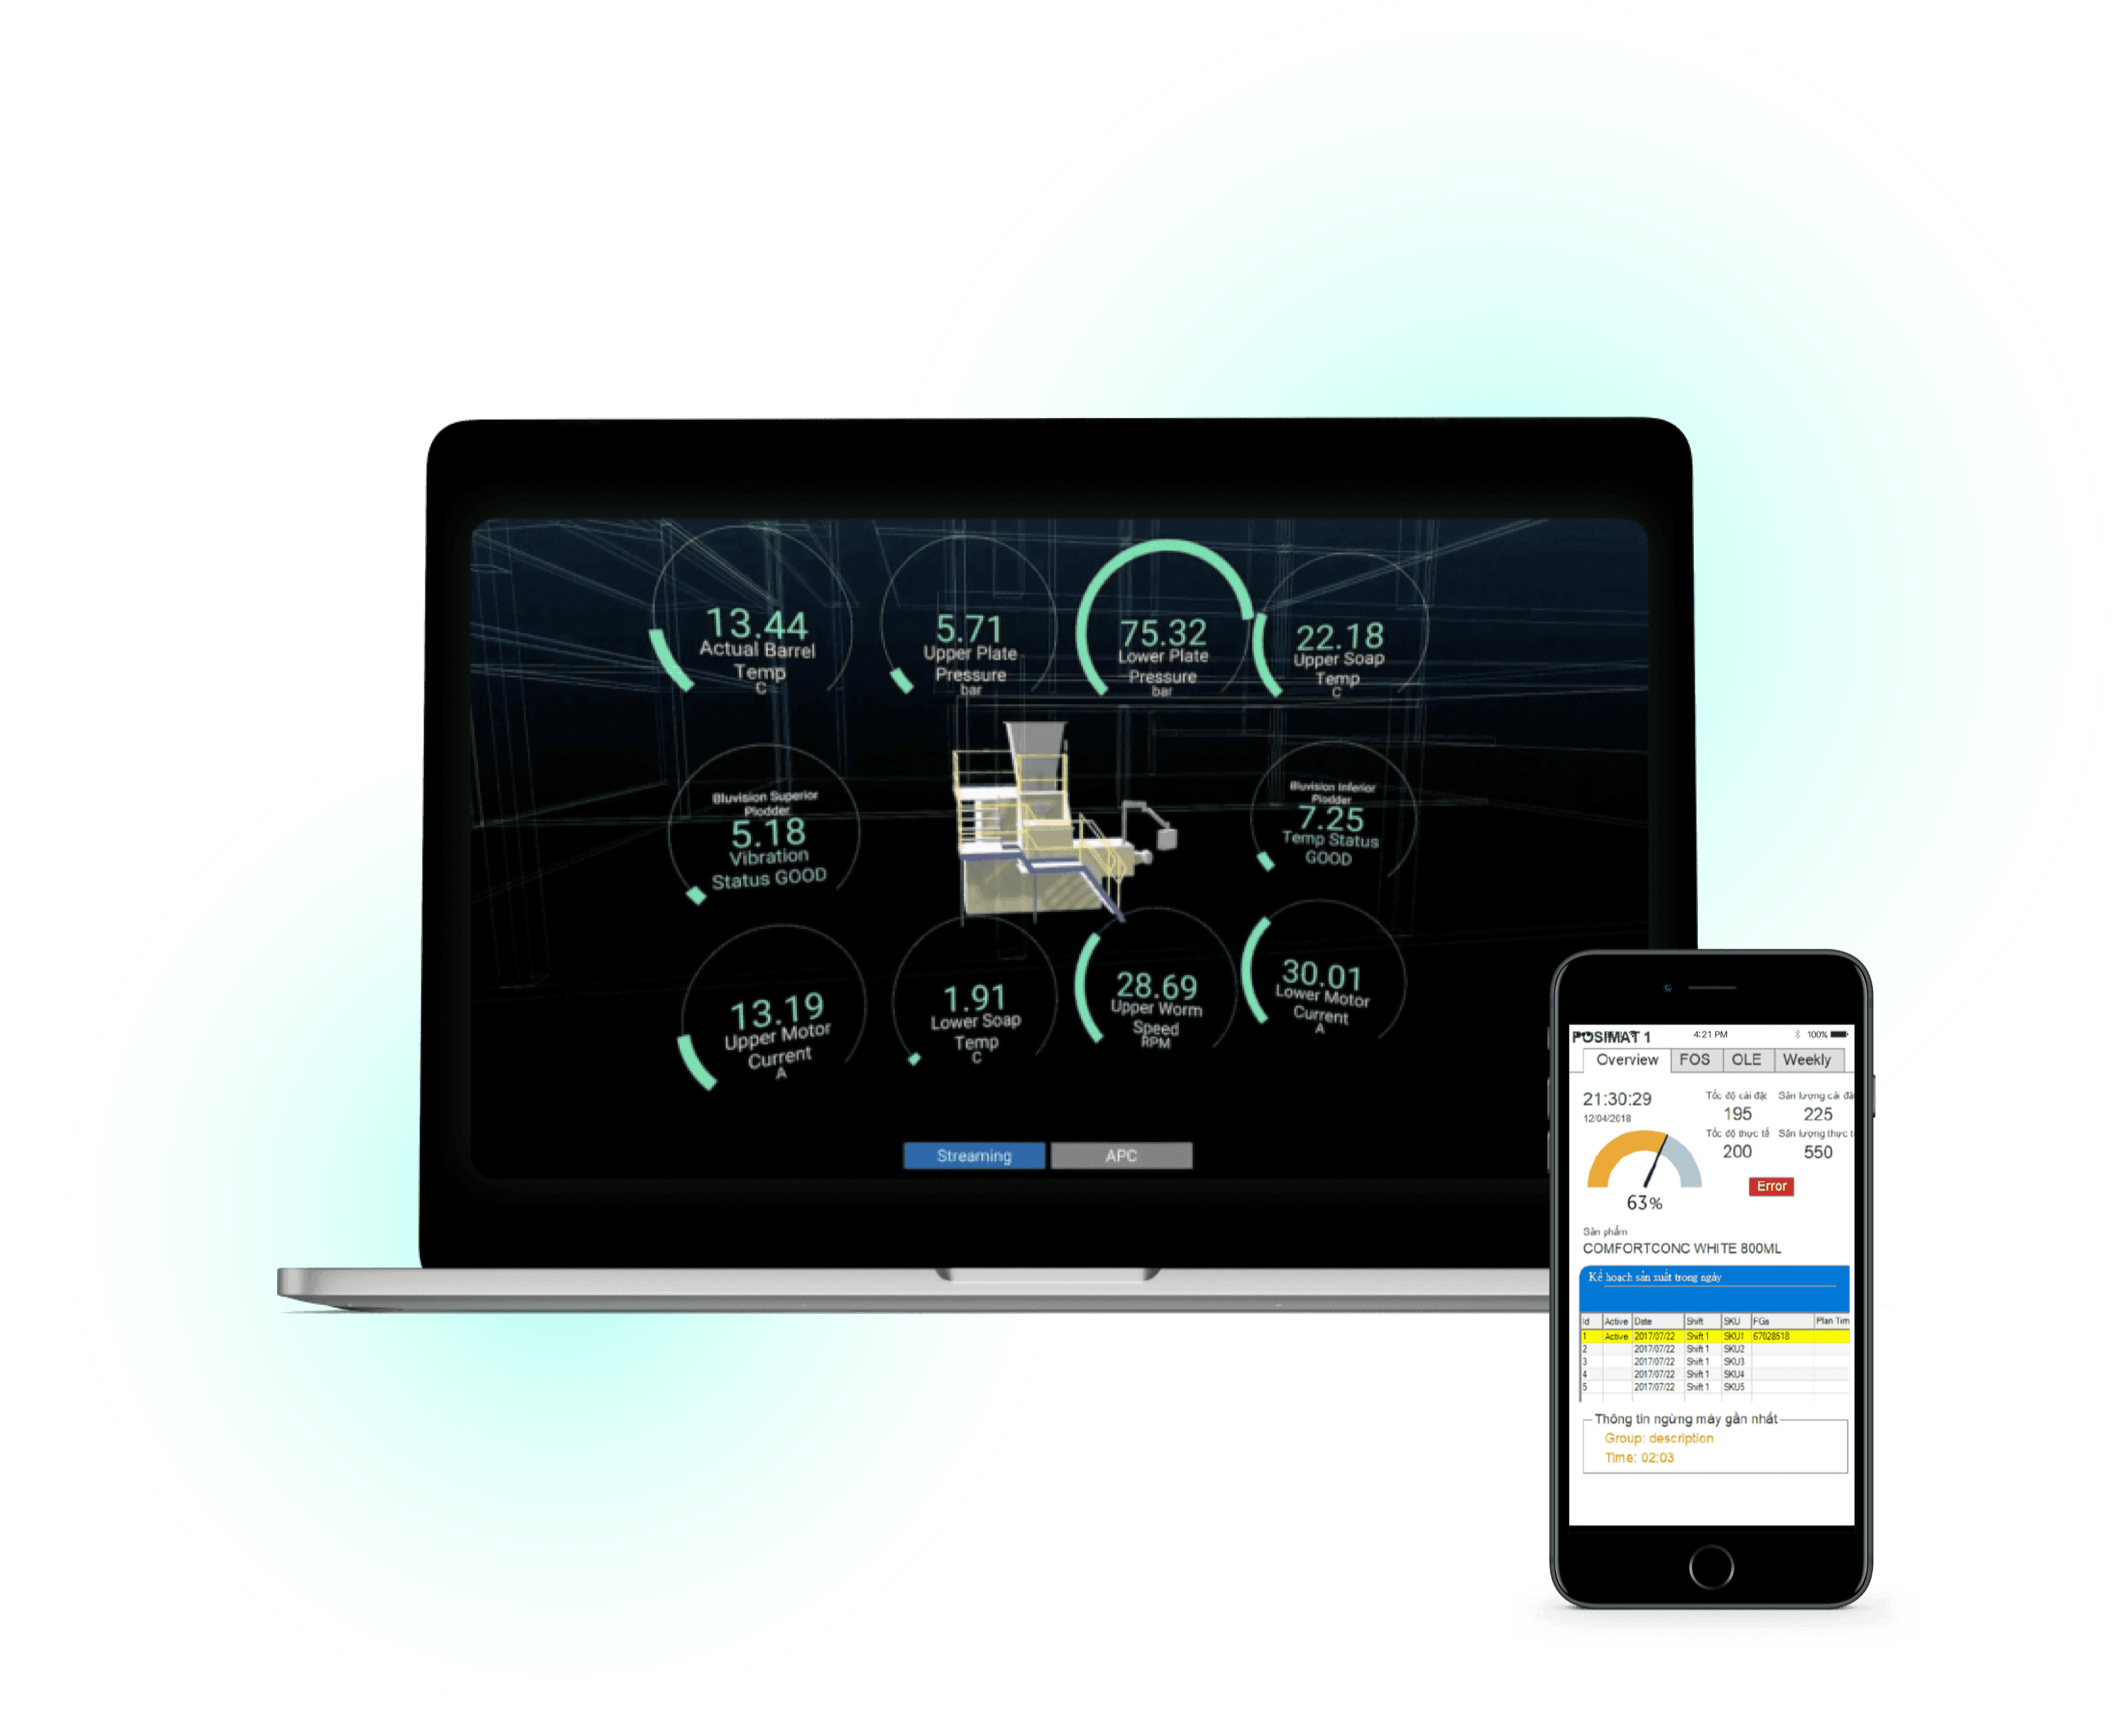


Summary
Digital Factory Operations System (DFOS) is a potent mix of BPM, RPA, IIOT, and AI. Our client's OEE was being recorded manually. They were not accessible in real-time, and the reliability was low.
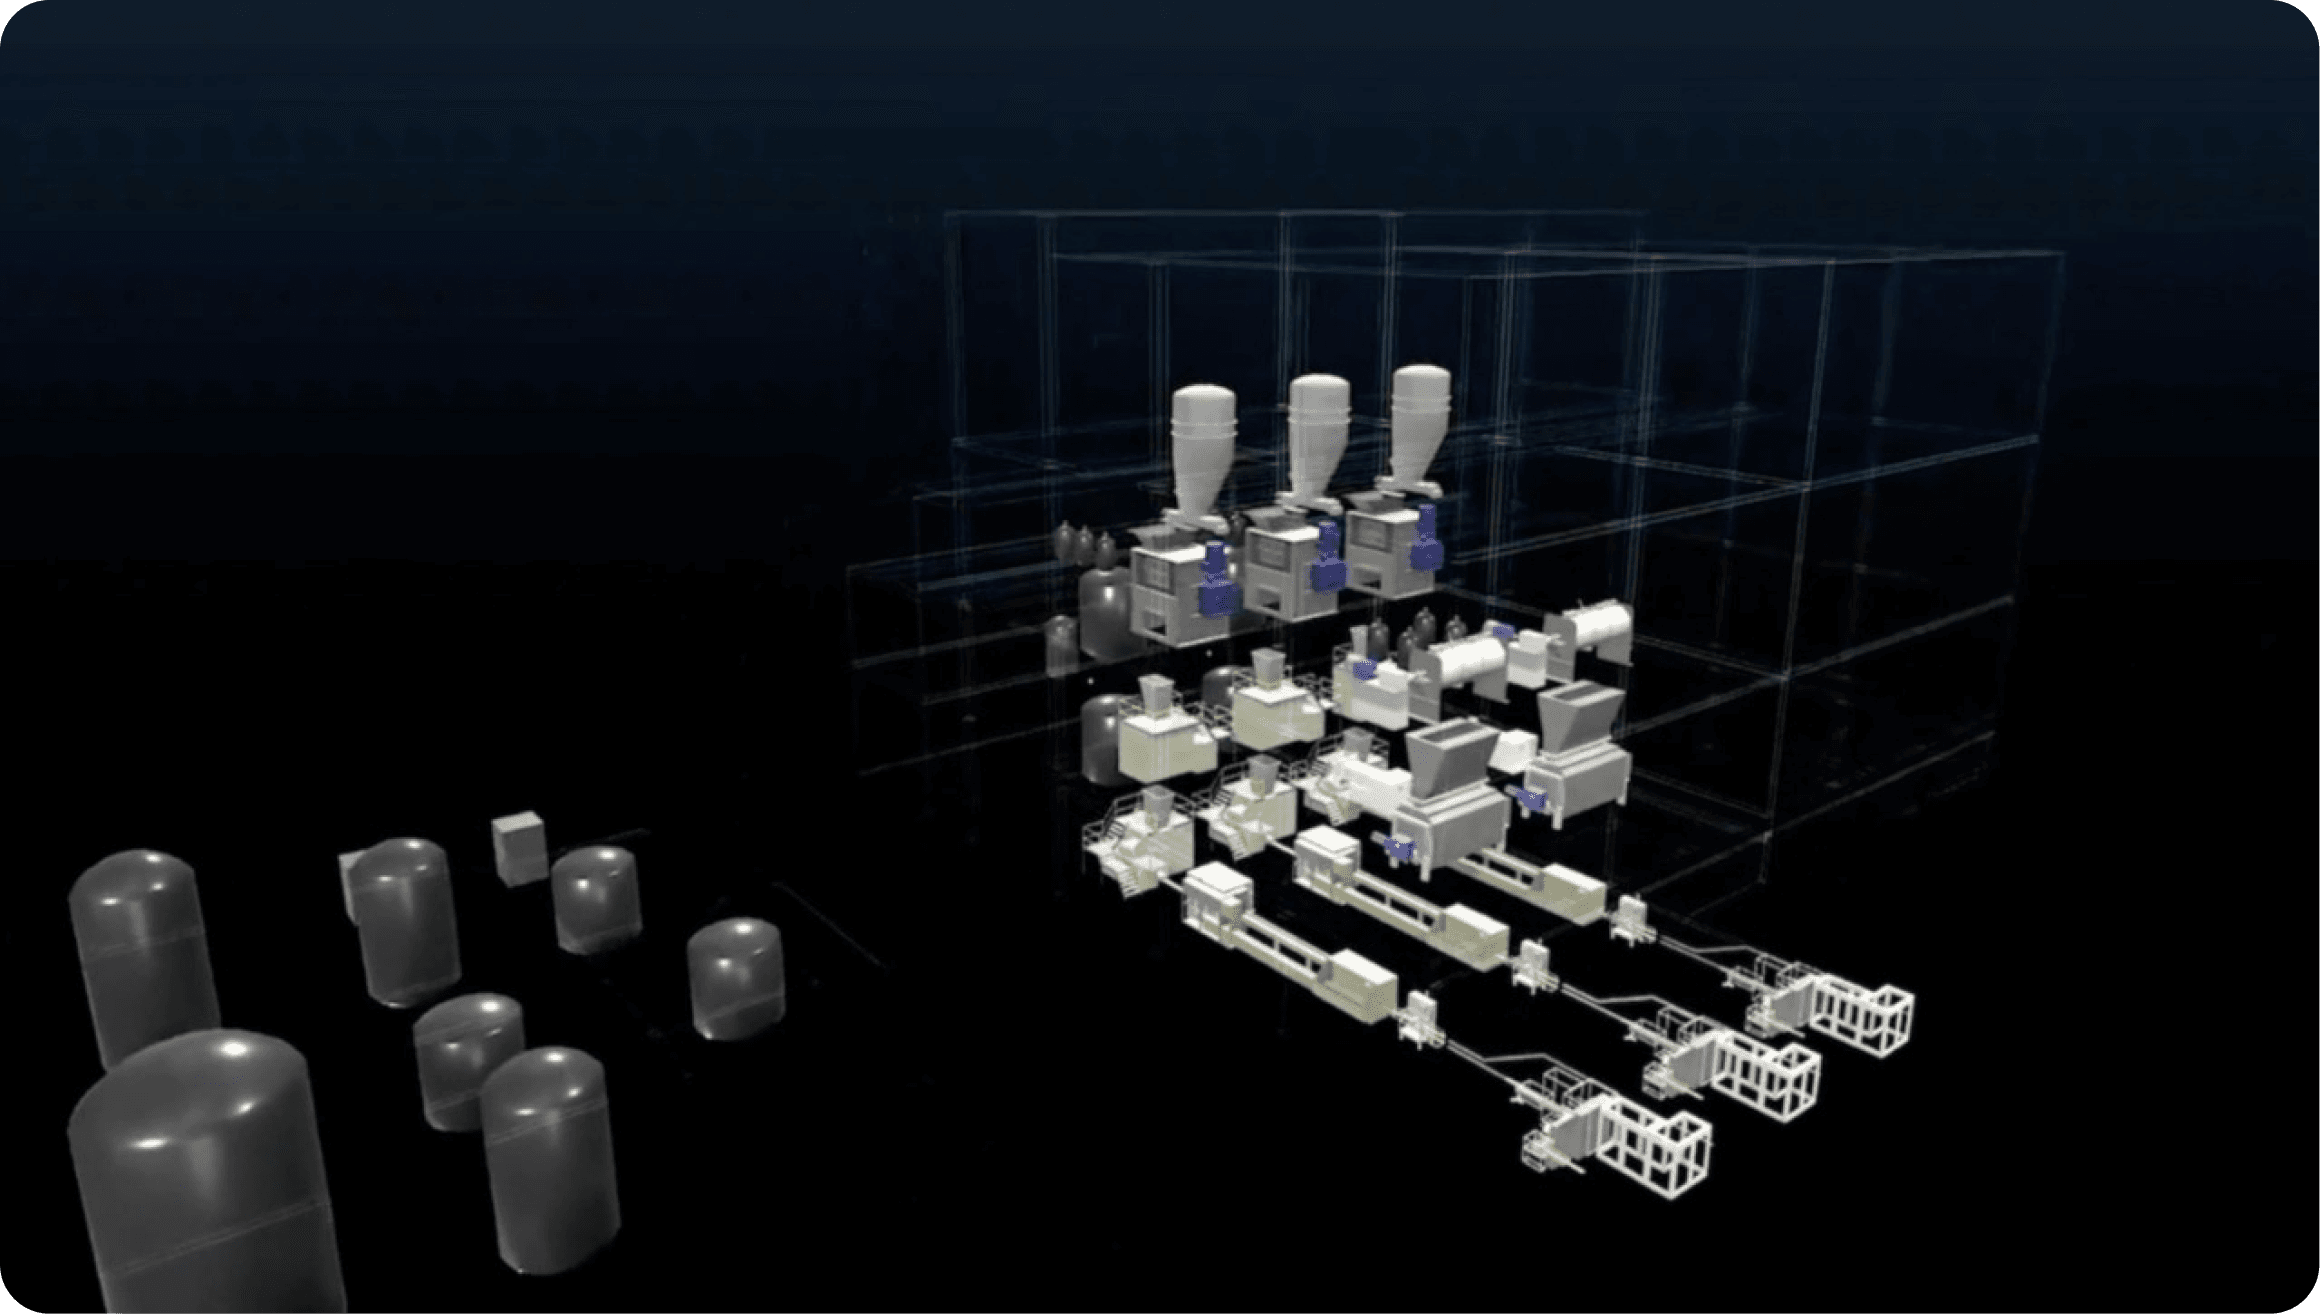
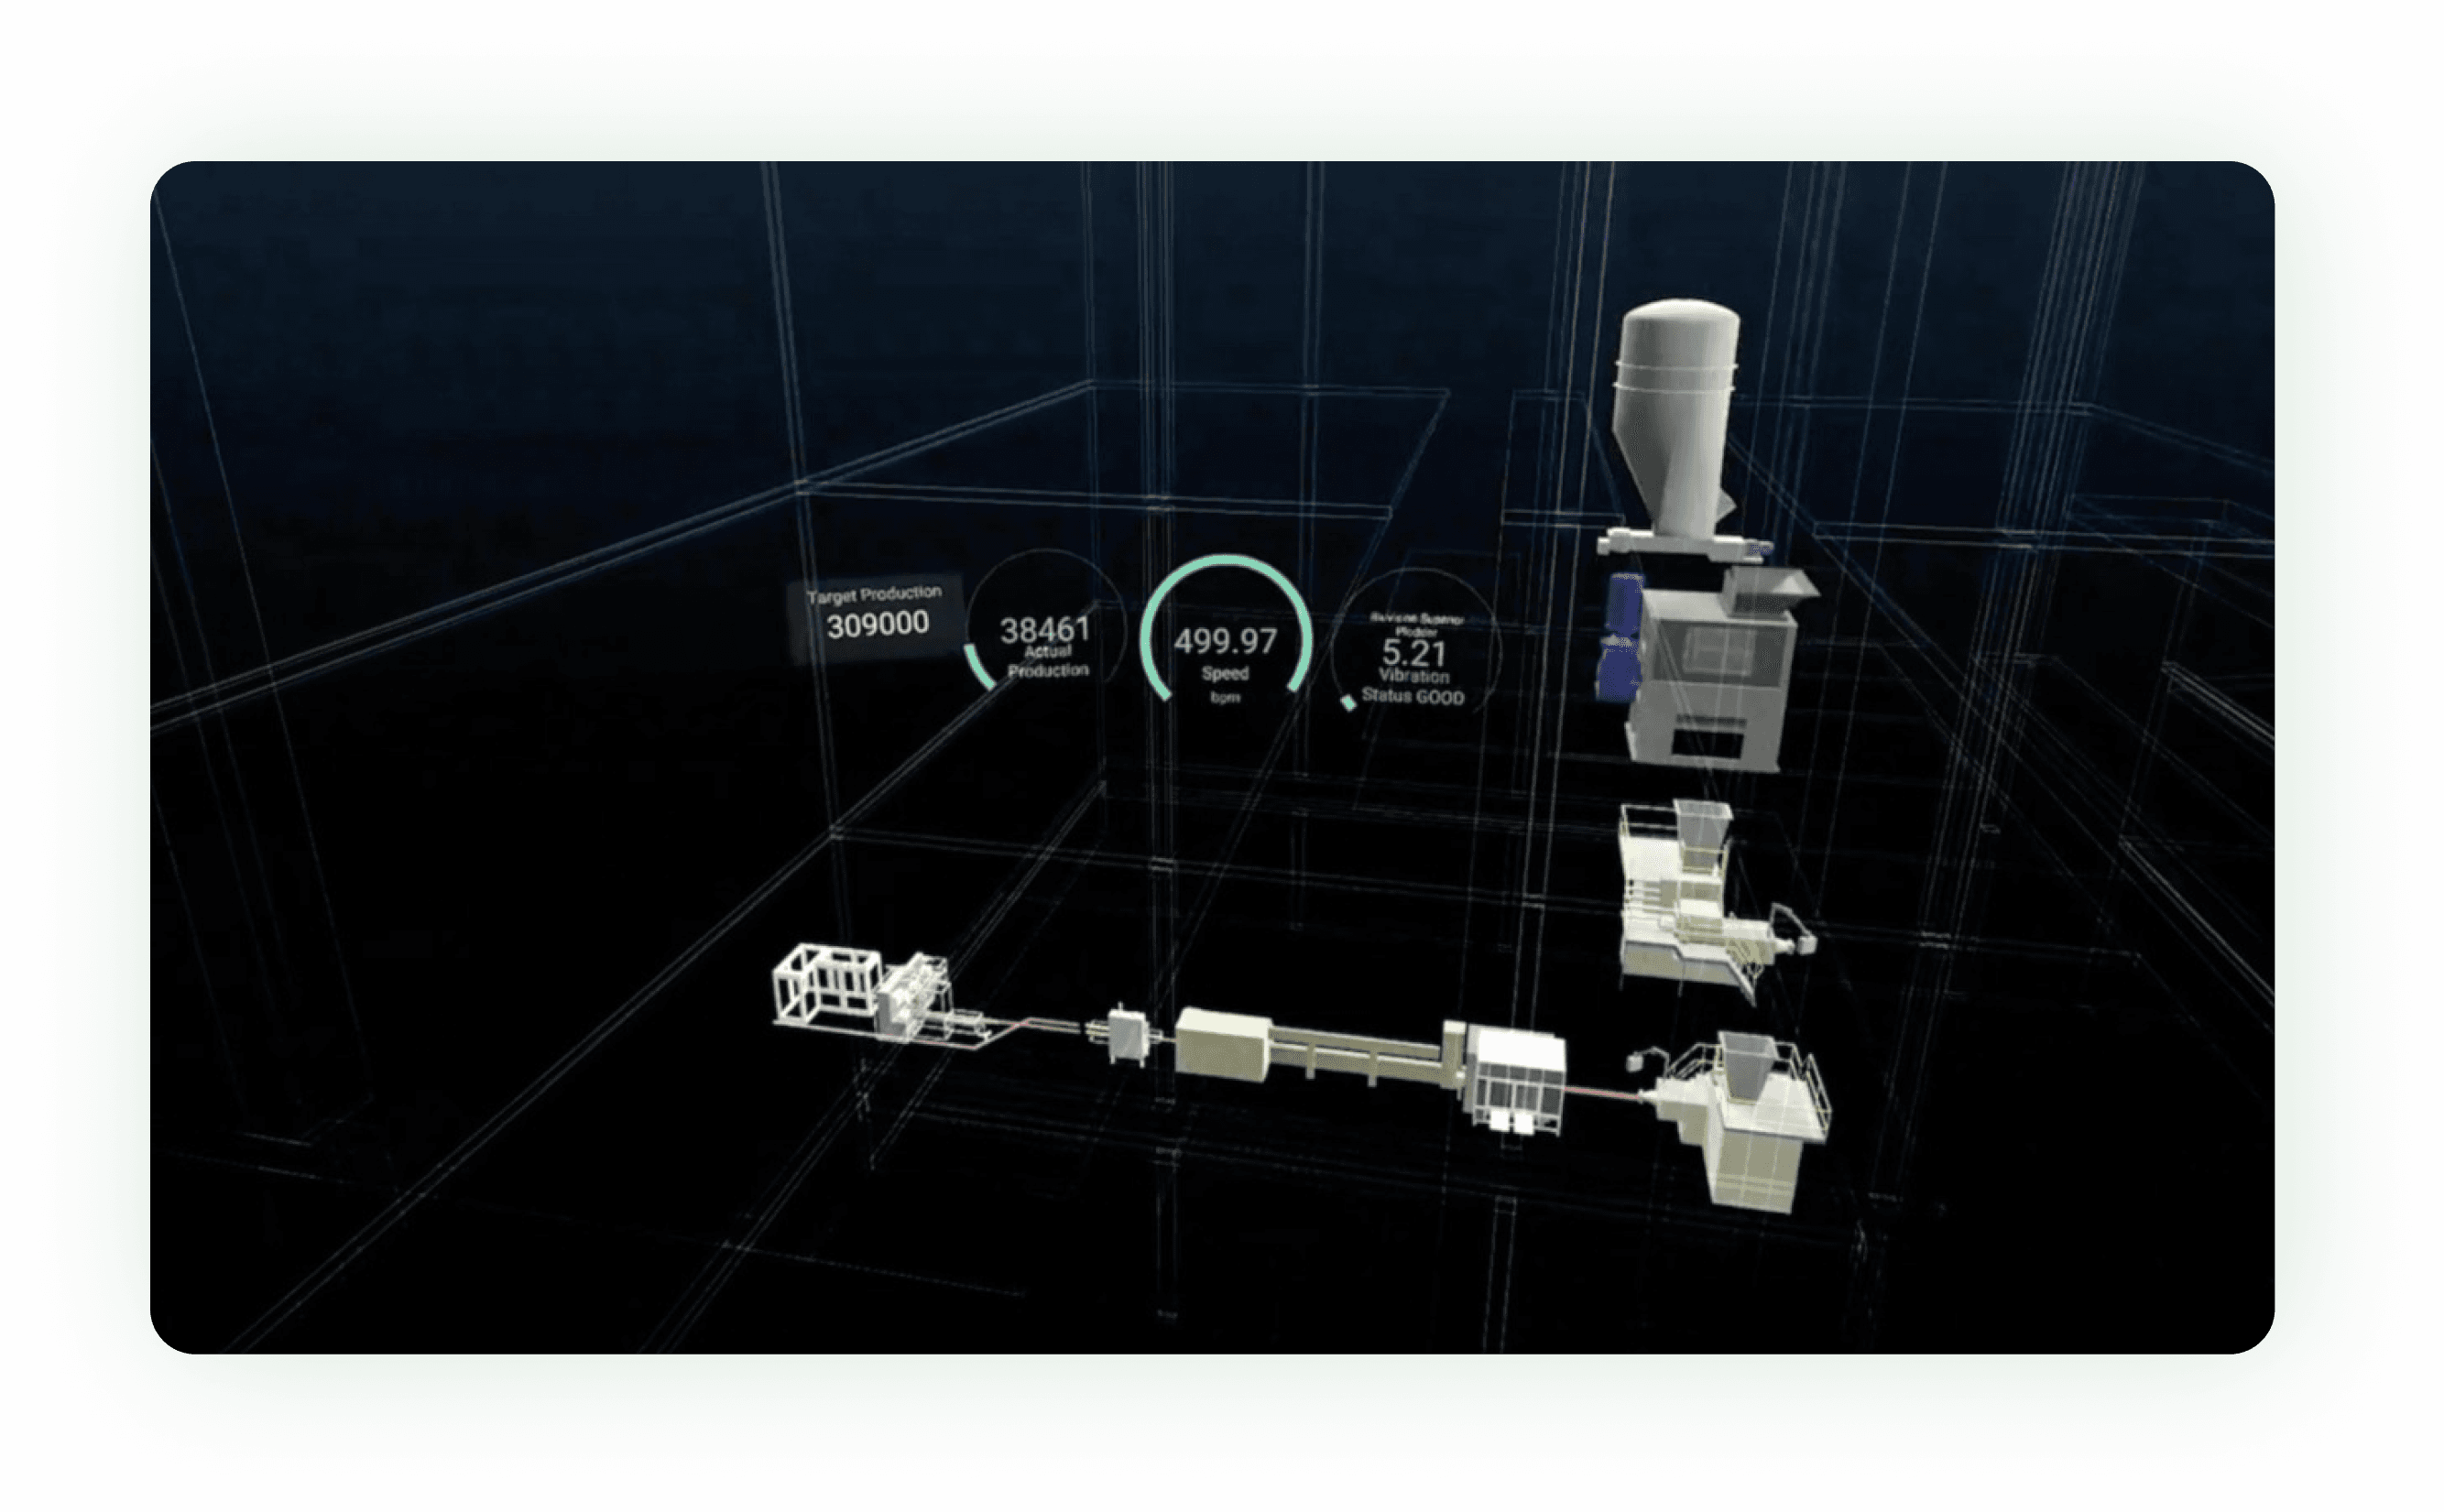
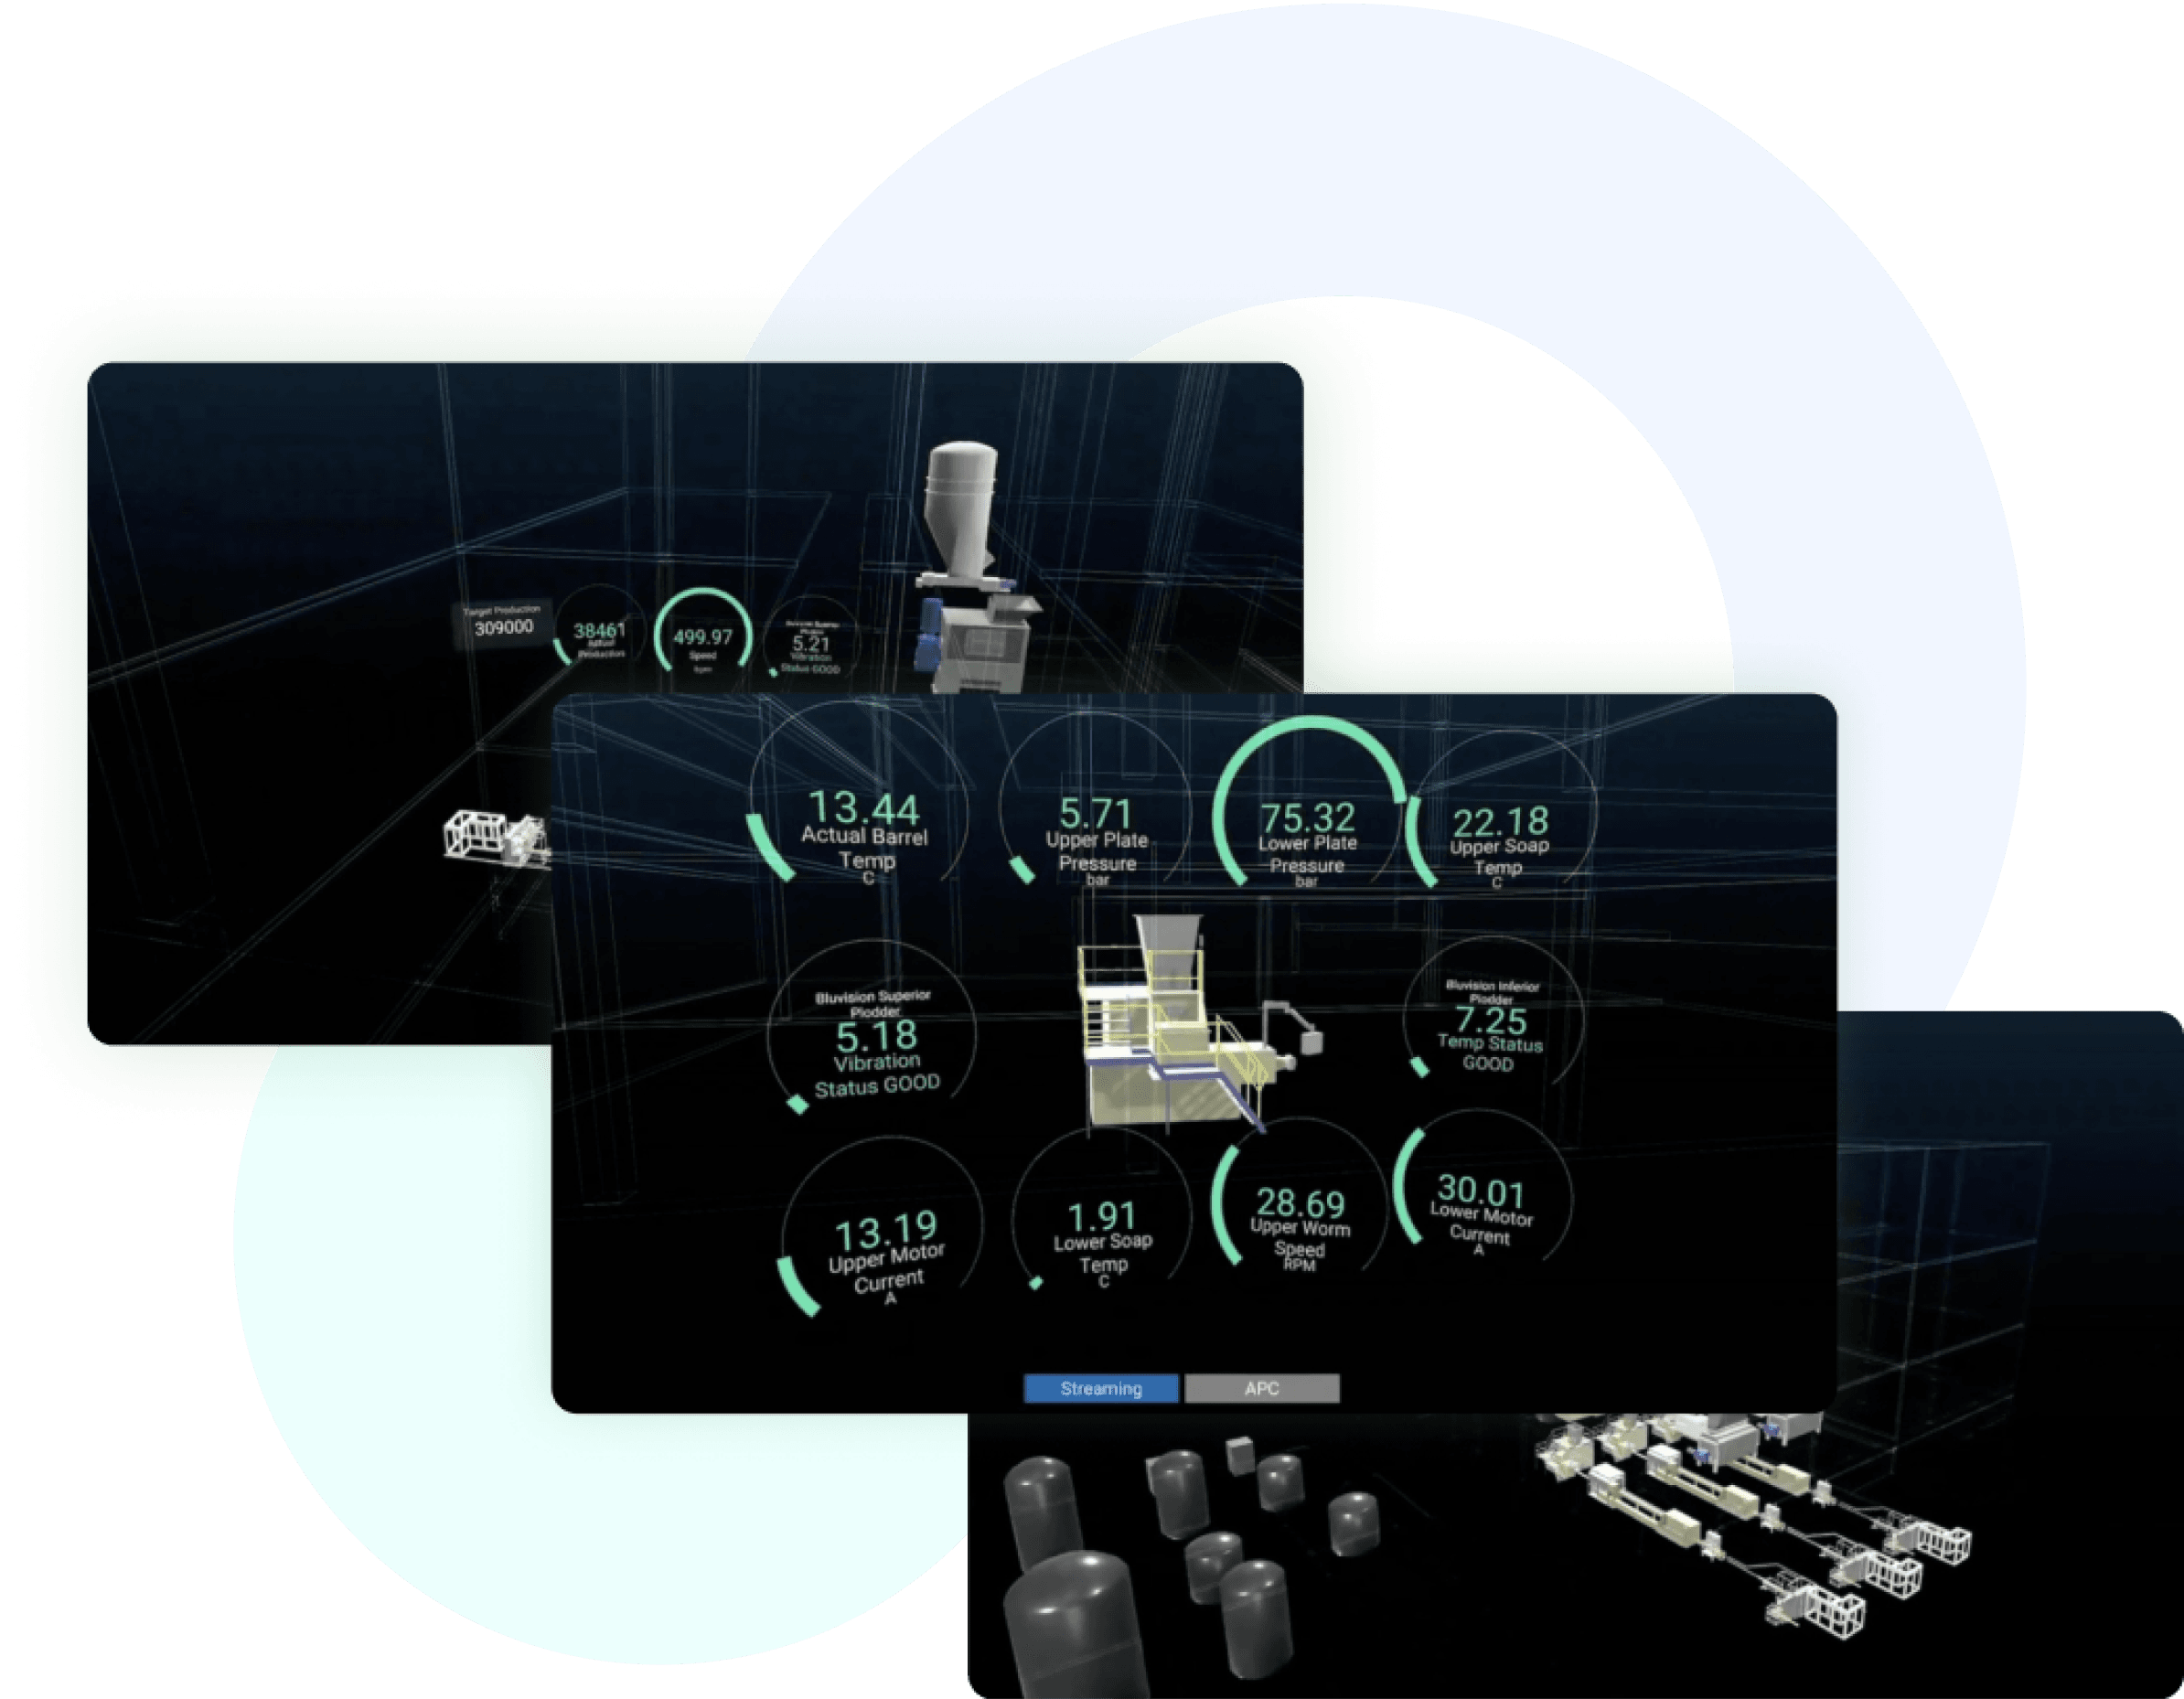
With a technical perspective, we recommended employing a counting sensor to monitor product condition, extract fault signals, and decode them from the control PLC of each machine. After that, the data visualization is displayed on production performance via a cross-platform and user-friendly interface.

PROBLEM
Project GoalsIt eliminates the complexity of legacy systems like ERP, SCADA, and MES while saving a large amount of money spent on the ongoing incremental adjustments.
DFOS provides real-time business updates on production, rejection, loss forecast, and MTT (Mean Time to Act) for a given problem to decision-makers.
PROCESS
Project Highlights
Manage production plans and SKUs
Effective management of production plans and SKUs is crucial for ensuring timely delivery of products, maximizing profitability, and maintaining customer satisfaction.
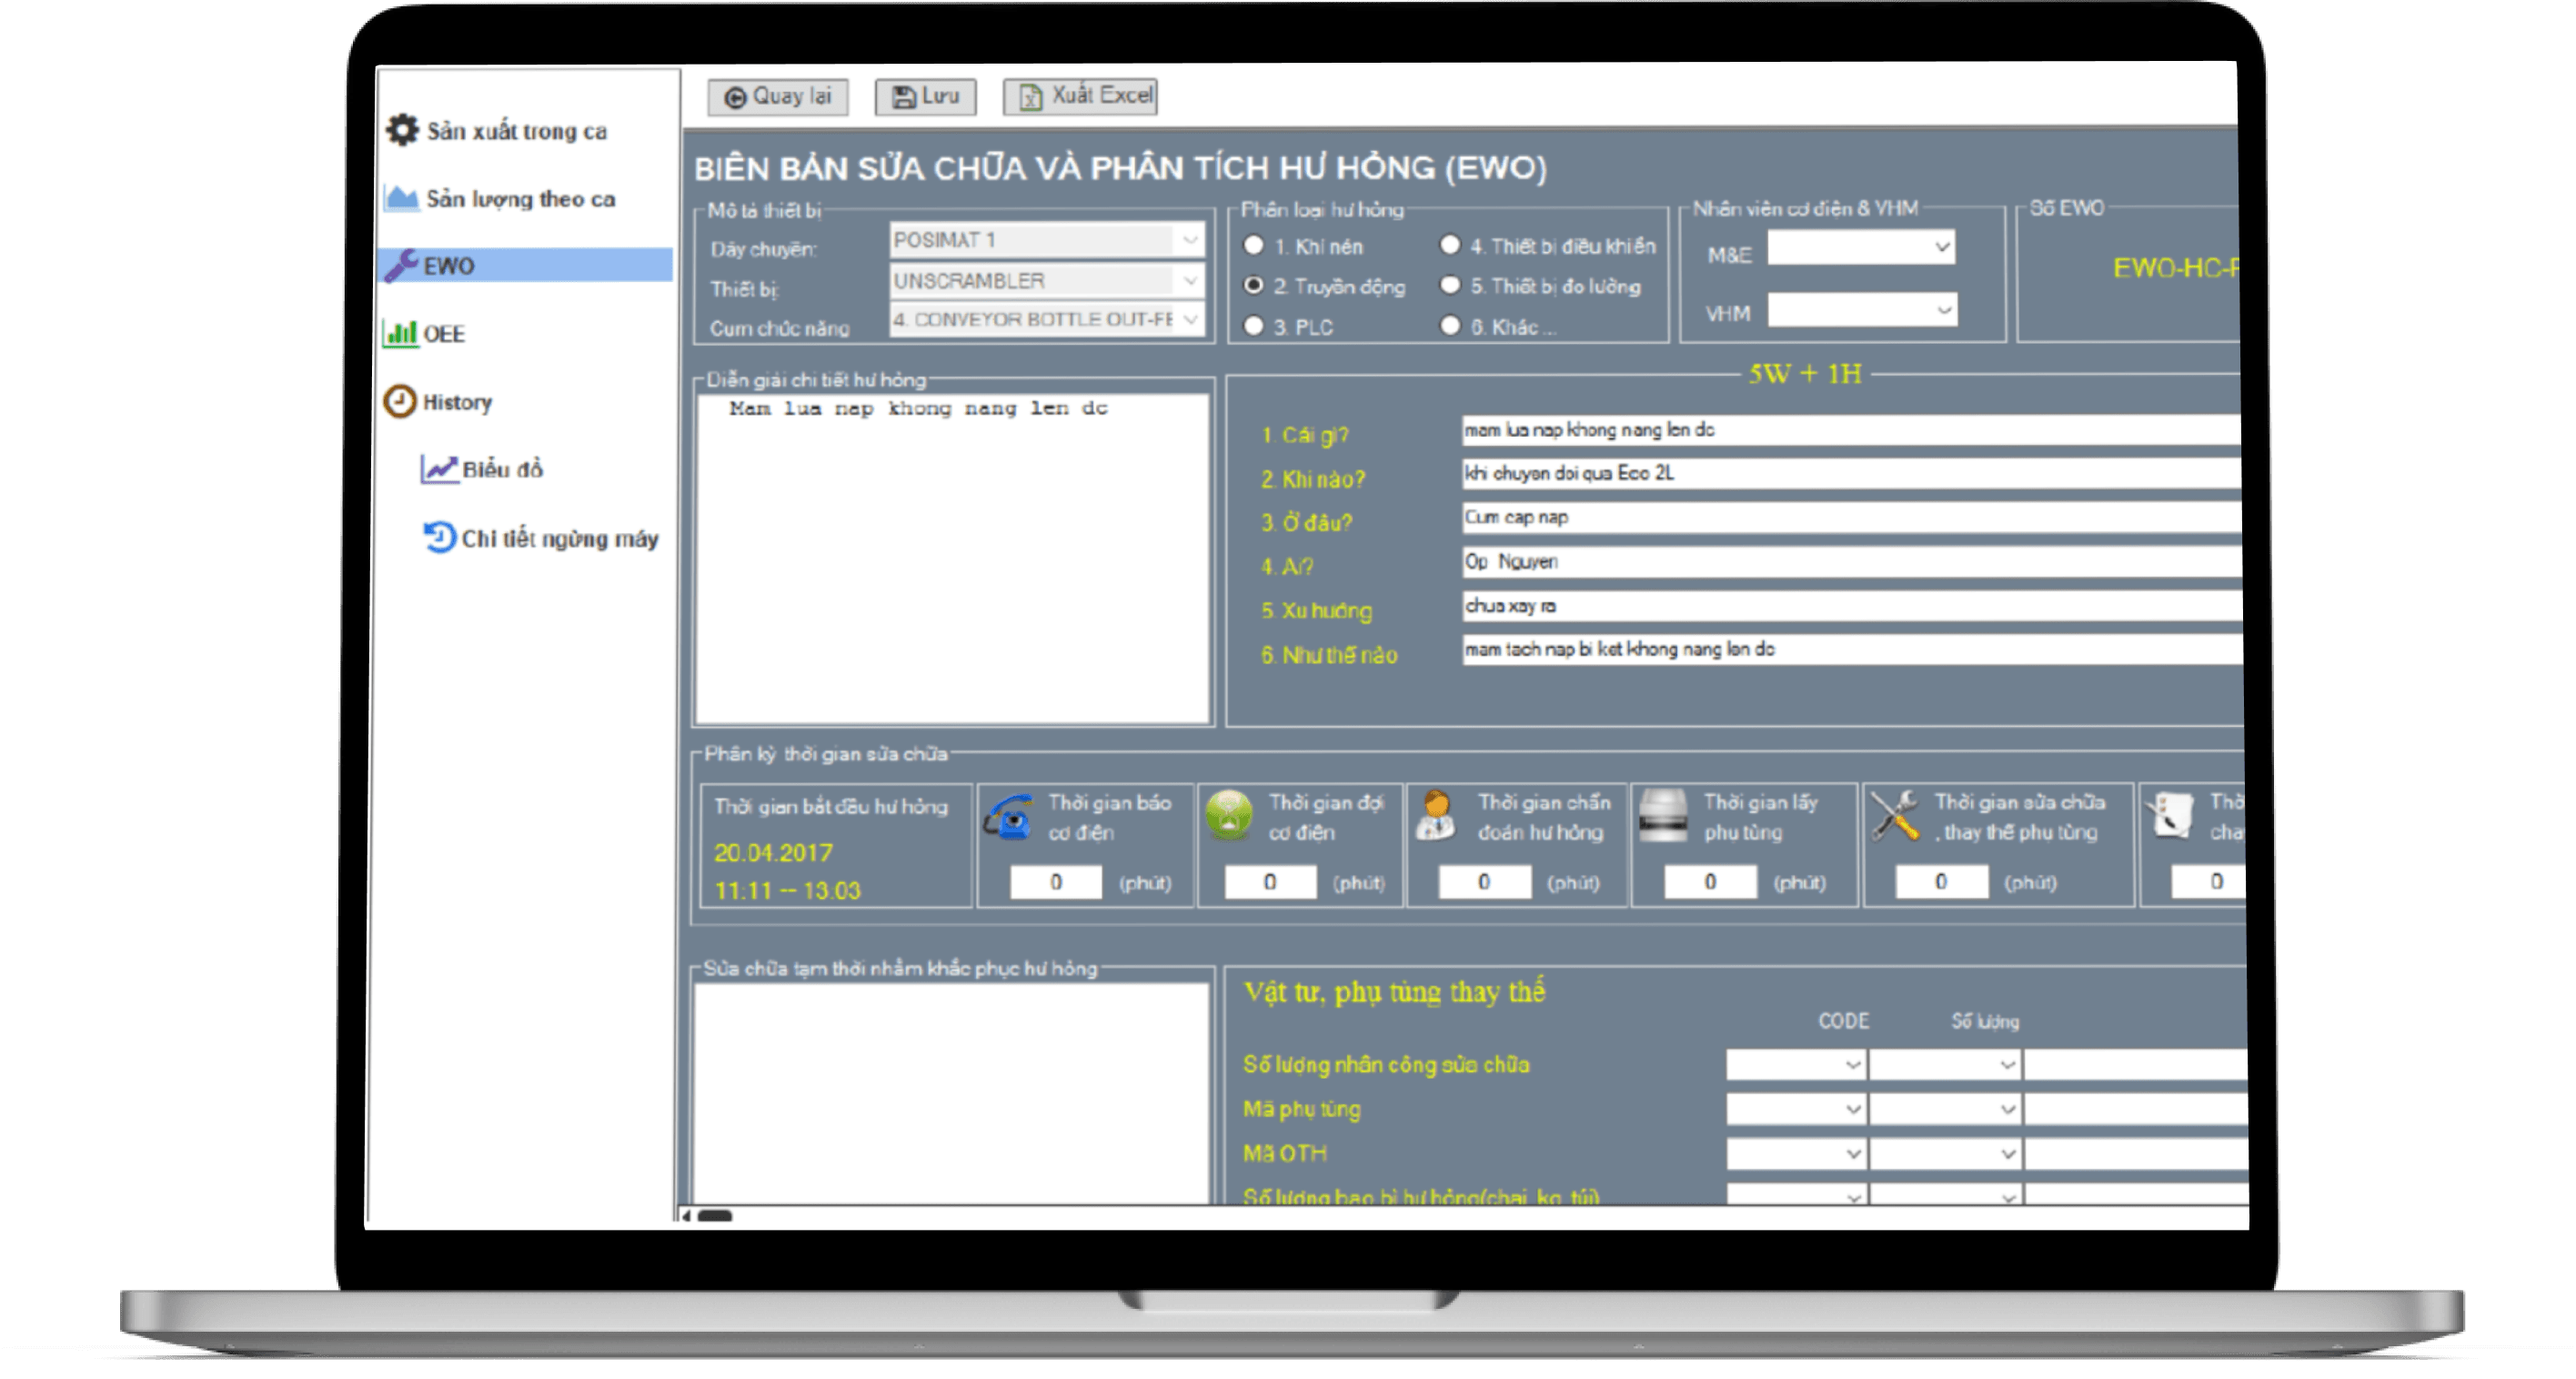
Minutes of repair and damage analysis
The minutes of repair and damage analysis are a written record of activities, decisions, and observations during an analysis or repair process. They include information on the damage or issue being analyzed, tools used, challenges encountered, and recommendations for future repairs.
Productivity Monitor
It collects data on tasks completed, time spent, and other performance metrics. Areas are identified for improvement and optimize productivity, efficiency, and overall performance.
Calculate performance and OEE
With this feature, our client can evaluate and improve the performance and efficiency of their equipment and processes, leading to increased productivity and profitability.

Record the loss of time, speed, materials, and packaging.
This feature help identify the root causes of the losses, quantify the impact on production output and costs, and develop strategies to minimize or eliminate the losses.
Report and analysis
- Blue highlight screen: line is running properly or in excess of standard
- Yellow: the line meets 80% of the production requirements, and is in the warning level
- Red: line that meets less than 80% of production requirements, needs to be processed.

Manage production plans and SKUs
Effective management of production plans and SKUs is crucial for ensuring timely delivery of products, maximizing profitability, and maintaining customer satisfaction.
Minutes of repair and damage analysis
The minutes of repair and damage analysis are a written record of activities, decisions, and observations during an analysis or repair process. They include information on the damage or issue being analyzed, tools used, challenges encountered, and recommendations for future repairs.
Productivity Monitor
It collects data on tasks completed, time spent, and other performance metrics. Areas are identified for improvement and optimize productivity, efficiency, and overall performance.
Calculate performance and OEE
With this feature, our client can evaluate and improve the performance and efficiency of their equipment and processes, leading to increased productivity and profitability.
Record the loss of time, speed, materials, and packaging.
This feature help identify the root causes of the losses, quantify the impact on production output and costs, and develop strategies to minimize or eliminate the losses.
Report and analysis
- Blue highlight screen: line is running properly or in excess of standard
- Yellow: the line meets 80% of the production requirements, and is in the warning level
- Red: line that meets less than 80% of production requirements, needs to be processed.
⭐⭐⭐⭐⭐
Achivements
- Factory status control at your fingertips
- Automatically detect and evaluate system flaws
- Data visualization with more interactive and user-friendly interface
Tech Stack
Frontend


Backend


3D


Cloud


MLTECH SOFT