With so many marketing metrics being monitored all the time, it’s important to know which ones are the most important. In an ideal world, marketing metrics should tell marketers which activities and marketing channels work best and where they can spend their marketing budgets more wisely. These metrics should also provide data that helps marketers determine who they are targeting, how they are targeting them, and how well that targeting is driving sales.
Some marketing metrics are useful for the entire marketing department. Most marketing departments should track the following common marketing metrics.
1 What Are the Most Important Market Metrics?
Measuring marketplaces for commodities versus services:
Much of the recent growth can be attributed to the market taking on its four high-level roles, which usually make it hard to do business in this space. Supply and demand aggregation, procurement tools, financing options, and logistics support
Usage Metrics:
The goal of tracking product usage metrics is to learn how users interact with the product, where they get stuck, and what features keep them on their feet longer. The Product Onboarding Engagement Rate measures the number of users engaged in in-app onboarding.
Active users:
The number of visitors who were active on your website over a specific period. The Google Analytics Active User Report helps you understand the engagement rate of your website (or mobile app). reports how often visitors return to her website over time.
Session Duration:
The length of a session is how long users usually spend talking to each other on a website. If the user is inactive for a predefined amount of time (by default he is 30 minutes), the session will end.
Screen Views:
Google Analytics keeps track of how screens change and adds information about the current screen to events. This lets you track things like user engagement and behavior per screen. Much of this data collection is automatic, but you can also record screen views manually.
Session Frequency:
Session frequency was found by dividing the total number of sessions by the number of weeks of treatment (the average number of times a single session was held for each subject).
Drop-Off Rate:
To figure out the dropoff rate, divide the number of people who stopped a purchase or request by the number of people who started a purchase or request. For example, if 2000 people visit her website and only 200 make a purchase, she has a 90% abandonment rate.
2. Metrics for Transactions
Trading metrics are at the heart of any trading company report. They answer your most important business questions. How much did you sell? How many times have you been called back? How much revenue did you generate, and what was your profit margin?
Average order value:
Average Order Value (AOV) is an e-commerce metric that measures the average sum of each order placed with a merchant over a defined period. AOV is one of the most important metrics for online stores to look at because it affects important business decisions like how much to spend on advertising, how to set up the store, and how much to charge for products.
Conversion rate:
The average number of conversions per ad interaction It is displayed as a percentage. The conversion rate is simply calculated by dividing the number of conversions by the total number of ad interactions that can be tracked toward conversion in the same period.

Abandoned cart rate:
There are two components to the abandoned cart recovery rate. Abandoned carts are the number of people who added items to their online shopping carts but didn’t check out. The recovery rate is the number of people who abandon their shopping carts but then go back to them and finish their purchases.
Buyer-to-seller ratio:
The buyer-seller overlap is the number of sellers who are also buyers. The buyer-seller ratio is the number of buyers divided by the number of sellers. Overlap of buyers and sellers occurs most frequently in peer-to-peer marketplaces such as B. in the case of second-hand sales
3. Metrics of Customer Satisfaction
By measuring customer satisfaction, we were able to keep more customers, build a strong brand image, spend less time and money on customer support, and make people more loyal to our brand.
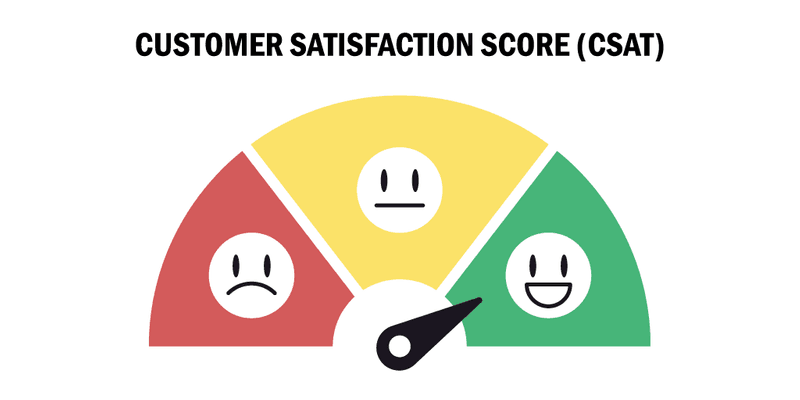
Customer Satisfaction Ratings:
Customer Satisfaction Score (CSAT) is a simple customer satisfaction survey method that measures customer satisfaction with a business. It is worked out by asking the customer questions about their experience and putting the answers on a scale from 1 to 3, 1 to 5, or 1 to 10.
Net Promoter Score (NPS):
The Net Promoter Score is the percentage of customers who are promoters (those who scored 9 or 10) minus the percentage of customers who are detractors (those who score between 0 and 6)
4. Business Metrics:
Business metrics are quantifiable measurements that companies use to track, monitor, and evaluate how well different business processes are working or not working. The main reason for using business metrics is to show how far along an organization is in reaching its short- and long-term goals.
Revenue:
Revenue is the total amount of money the company makes from selling goods or services that are related to its main business. Earnings, also known as gross earnings, are often referred to as the “top line” because they are at the top of the income statement. “Income” or “net profit” is the gross profit or profit of a business.
Profit Margin:
Profit margin is a profitability indicator that indicates whether a business is profitable. shows what percentage of the company’s sales have been converted into profit, or how many cents per dollar are generated per sale. Analysts and investors can use profit margins to figure out how healthy and well-off a company is financially. Profit margins include the gross profit margin and the operating profit margin.

Customer LTV:
Customer lifetime value (CLV) is one of the most important statistics to track as part of your customer experience program. CLV is a measure of how valuable a customer is to a business, not just on a buy-by-buy basis but across the customer relationship.
Customer Acquisition Cost (CAC)
Customer acquisition cost (CAC) measures the amount a business spends to acquire a new customer. CAC is one of the most important business metrics. It is the total cost of sales and marketing activities, real estate, and equipment that are needed to convince customers to buy your product or service.
Gross merchandise value (GMV)
Gross merchandise value (GMV) refers to the value of goods sold between customers or through an e-commerce platform. The total price of the item is calculated before any fees or charges are deducted. This is a way to grow your business or use the site to sell things that belong to other people.
Gross Transaction Value (GTV):
Gross Transaction Volume or “GTV” means the total dollar value of transactions processed through our cloud-based SaaS platform during the Period, less any refunds, including shipping, handling, customs, and sales taxes
5. Vanity Metrics: What to Avoid Downloads:
Vanity metrics are nice-looking statistics, but they don’t always lead to meaningful business results. Examples are social media follower counts and promotional video views.
Screen views
A screen view in Google Analytics represents the content a user is viewing in your app. The equivalent concept for websites is pageviews. By measuring screen views, you can see what content users view most often and how they navigate between different types of content.
Time spent in the app:
Time tracking allows you to track the time spent on individual tasks and the entire project. This helps you figure out how accurate your work estimates are and how well your employees are doing their jobs.
Social media followers:
In social media, a “follower” is someone who subscribes to your account to receive all updates. This refers to users who consciously choose to see all of another user’s posts in their newsfeed. One of the main goals of any online business on social media is to get more followers.
6. Market Metrics to Keep an Eye on for Ongoing Discovery:
Marketing metrics are numbers that show how well an ad campaign is doing and can be linked back to KPIs.
Create a procedure for getting consumer feedback:
Feedback is a powerful guide that can provide your leadership team with insights that point the way forward for all parts of your company, from product to UX to customer support. This is especially important when it comes to customer satisfaction.
Analyze use statistics:
Statistical analysis means using quantitative data to examine trends, patterns, and relationships. It is an important research tool used by scientists, governments, businesses, and other organizations.
Use A/B testing:
A/B testing lets people, teams, and organizations change the user experience on purpose while collecting data about what happens. This lets us make guesses and figure out why certain parts of the experience affect how people act.

Measuring and evaluating metrics is key to making sure your marketplace is on the road to success. Metrics for online marketplaces help you figure out how well your marketplace is doing, where changes need to be made, and how to improve performance. Achievements may vary by marketplace type. Which one you use for your business depends on what areas you want to focus on for improvement.
We hope this exchange serves as an introduction to some of the key marketplace metrics that many marketplace companies use to measure their success in the market. Check the MLTech Soft blogs for more useful articles!